

Introduction
Candlestick patterns are an important part of Forex trading. They help traders understand market sentiment and predict possible price movements.
In this guide, you will learn what candlestick patterns are and how they are used in trading.
What is Candlestick Pattern in Forex
A candlestick pattern is a visual representation of price movement on a chart.
Each candle shows four things
Open price
Close price
High price
Low price
In simple words
Candles show how price moves in a specific time period
Structure of a Candlestick
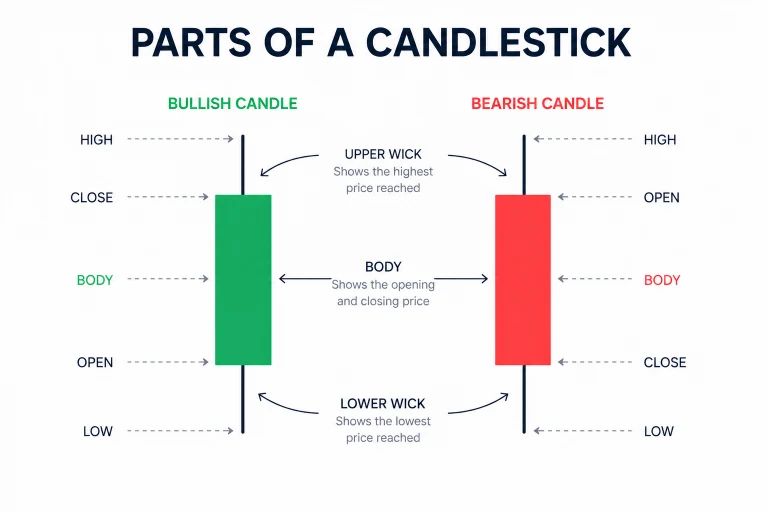
Body
The body shows the difference between open and close price.
Wick
The wick shows the highest and lowest price reached.
Bullish Candle
Close price is higher than open price.
Bearish Candle
Close price is lower than open price.
Types of Candlestick Patterns
Reversal Patterns
These patterns indicate a possible change in trend.
Examples
Hammer
Shooting Star
Continuation Patterns
These patterns suggest the trend will continue.
Examples
Doji
Spinning Top
Common Candlestick Patterns
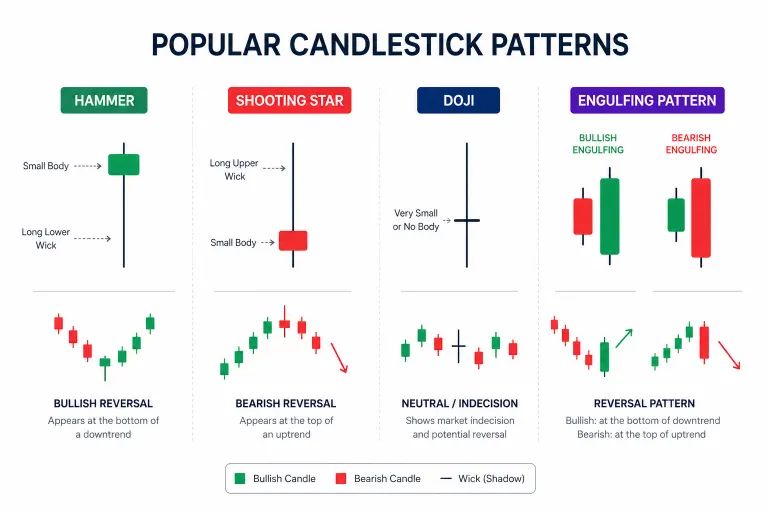
Hammer
Appears at the bottom of a trend and signals a possible reversal upward.
Shooting Star
Appears at the top of a trend and signals a possible reversal downward.
Doji
Shows market indecision where open and close are almost equal.
Engulfing Pattern
A strong pattern where one candle fully covers the previous candle.
Why Candlestick Patterns are Important
Market Sentiment
They show buyer and seller strength.
Entry and Exit Signals
Help in deciding when to enter or exit a trade.
Works with Price Action
Candlestick patterns are a key part of price action trading.
How to Use Candlestick Patterns
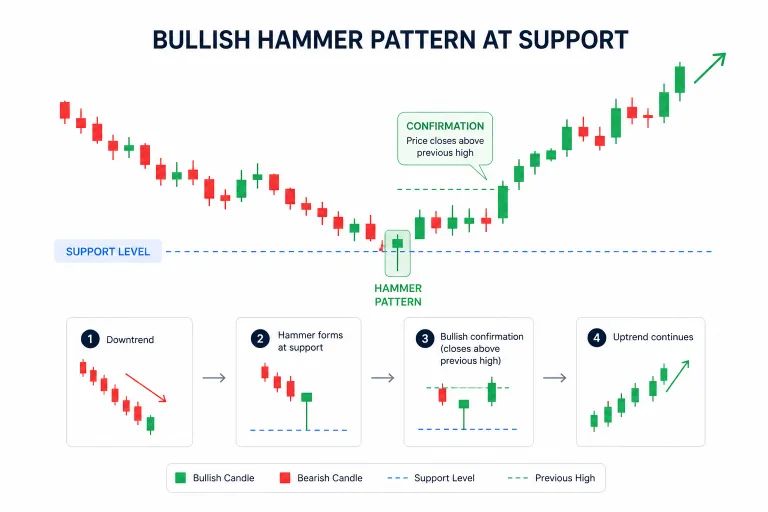
- Identify pattern at support or resistance
- Confirm with trend direction
- Combine with risk management
- Avoid trading based on one candle only
Common Mistakes
- Trading every pattern
- Ignoring market context
- Not waiting for confirmation
Best Practice for Beginners
- Focus on a few patterns
- Practice on demo account
- Combine with other concepts
Pro Tip
Candlestick patterns work best when used with support and resistance levels.
Conclusion
Candlestick patterns help you read the market more clearly.
If you understand them properly, you can improve your trading decisions and timing.
