

Introduction
Chart patterns are formations created by price movement on a Forex chart. Traders use these patterns to identify possible market direction and trading opportunities.
In this guide, you will learn what chart patterns are, their types, and how they help in trading.
What is Chart Pattern in Forex
A chart pattern is a shape formed by price movement on a trading chart.
In simple words
Chart patterns help traders understand what the market may do next
Types of Chart Patterns
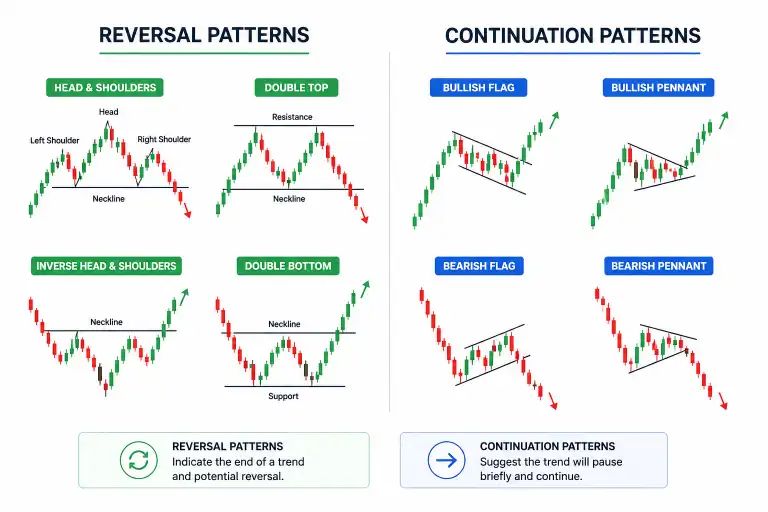
Reversal Patterns
These patterns indicate a possible trend reversal.
Examples
Head and Shoulders
Double Top
Double Bottom
Continuation Patterns
These patterns suggest the current trend may continue.
Examples
Triangle
Flag
Pennant
Common Chart Patterns
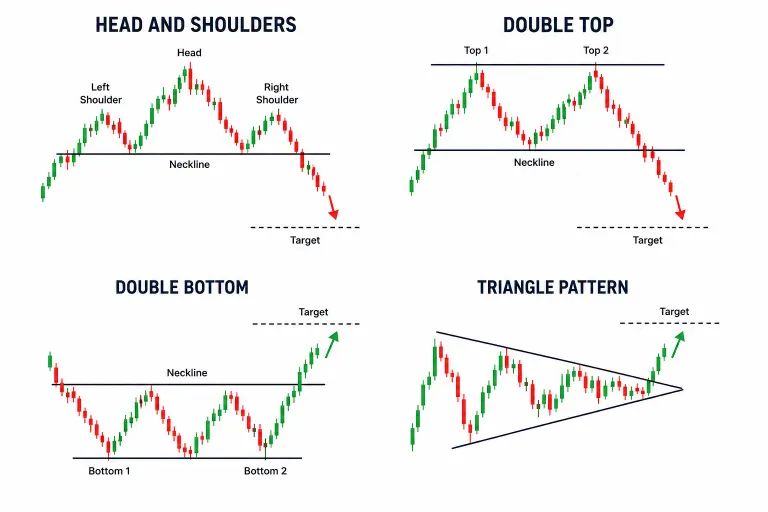
Head and Shoulders
A bearish reversal pattern that appears after an uptrend.
Double Top
A pattern showing price failing to break resistance twice.
Double Bottom
A bullish reversal pattern showing price holding support twice.
Triangle Pattern
A continuation pattern where price moves inside converging trendlines.
Flag Pattern
A short consolidation before trend continuation.
Why Chart Patterns are Important
Trend Identification
Patterns help traders understand market direction.
Trade Opportunities
They provide entry and exit signals.
Risk Management
Patterns help in placing Stop Loss and Take Profit levels.
How to Trade Chart Patterns
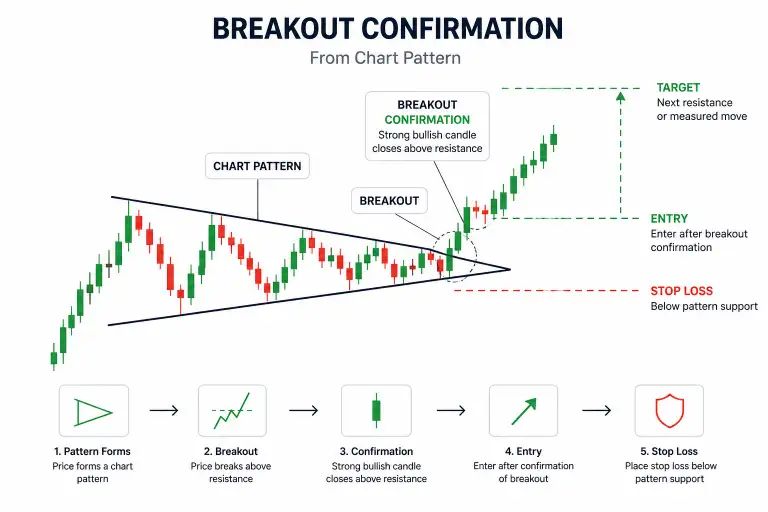
- Identify the pattern clearly
- Wait for breakout confirmation
- Use Stop Loss properly
- Follow trend direction
Common Mistakes
- Trading incomplete patterns
- Ignoring volume and confirmation
- Entering too early
Best Practice for Beginners
- Focus on simple patterns first
- Practice pattern recognition daily
- Combine with support and resistance
Pro Tip
Wait for confirmation before entering a trade. A confirmed breakout is more reliable than guessing.
Conclusion
Chart patterns help traders understand market behavior and possible price movement.
If you learn them properly, they can become a powerful part of your trading strategy.
